Independent research · Engineering
AI Cancer Detection and Classification
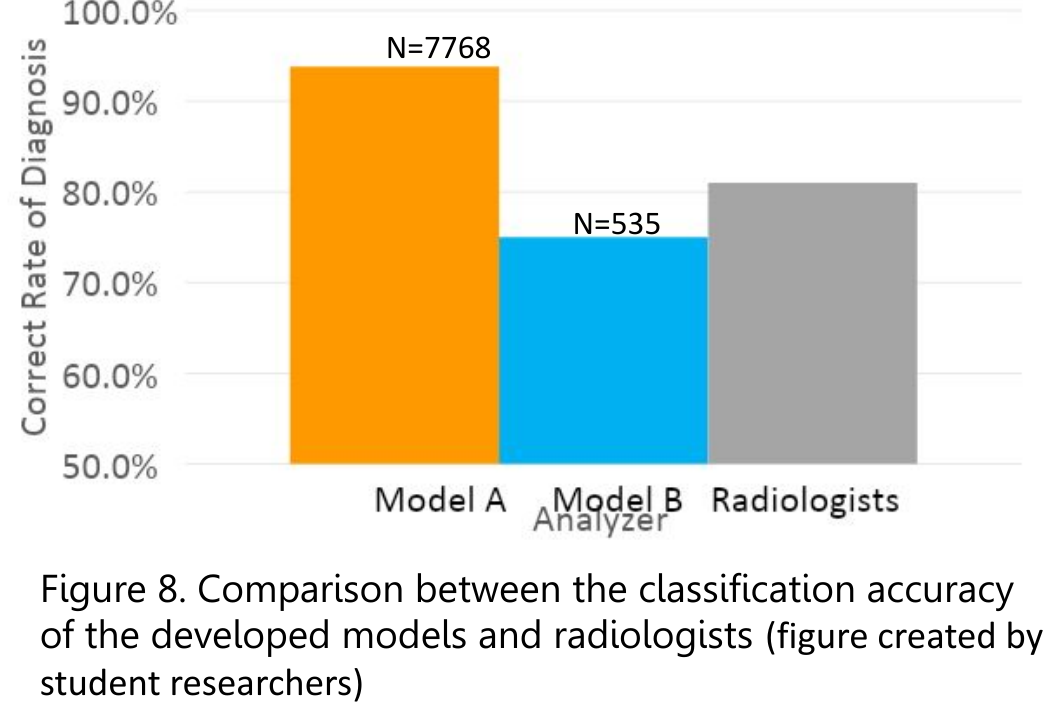
Built a two-stage CNN that finds lung nodules in CT scans with 93.8% accuracy and classifies them as malignant or benign at 75.5%, against 81% for radiologists. Independent research, built from scratch.
Independent researcher · Passion project

Results
Context
This was a passion project: a system to detect and classify lung tumors in chest CT scans. Lung cancer killed about 1.69 million people worldwide in 2015, and misdiagnosis accounts for tens of thousands of those deaths. The most common form is non-small cell lung cancer.
A CT scan is a three-dimensional reconstruction built from a series of cross-sections, and it's the standard first step in diagnosis. A radiologist searches the slices for suspicious regions and then judges each one. I built and trained the models myself, using annotated scans from the public Cancer Imaging Archive.
Constraints
- Public data only, and not much of it: 7,768 images for detection and 535 for classification.
- A network built from scratch, with no pretrained weights.
- No clinical partner to check results against real patients.
Problem
Reading a CT scan is slow and error-prone: a radiologist has to find the nodules across every slice, then decide which are malignant. The idea was a first-pass reader that flags nodules and scores them, as a second set of eyes.
North starDetection and classification accuracy on held-out scans, compared with the 81% radiologist benchmark.
Decisions
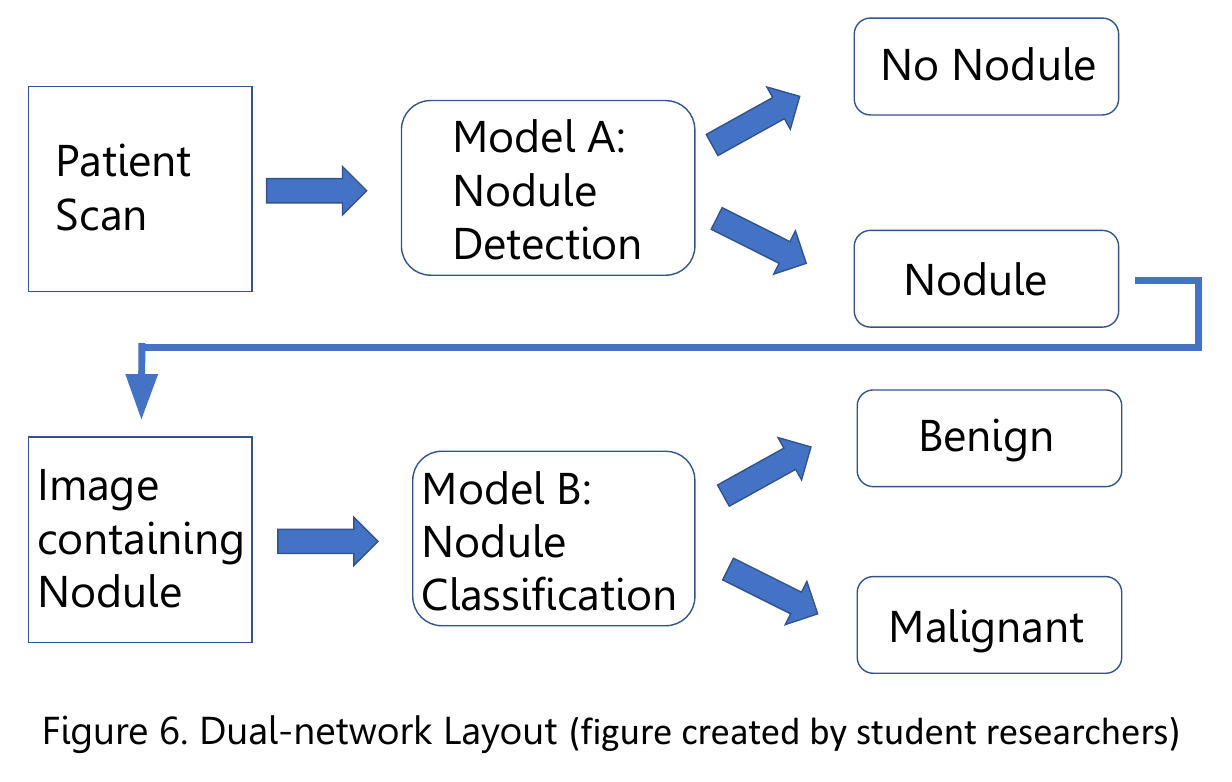
Two networks in sequence
- Options
- One network that outputs no nodule, benign, or malignant, or two in sequence.
- Evidence
- The tasks had very different amounts of labeled data: 7,768 images for detection but only 535 for classification.
- Chose
- A detector that outputs nodule or no nodule. Only scans with a nodule pass to a second network that outputs benign or malignant.
- Didn't build
- A single three-class model.
- Cost
- Errors compound: a missed nodule never reaches the classifier.
Build it from scratch
- Options
- Starting from a pretrained network, or designing my own.
- Evidence
- I wanted to understand every layer, and the images were small and consistent enough for a compact model.
- Chose
- Four convolution layers (two with 32 filters of 8×8, two with 64 filters of 4×4), ReLU, 2×2 max pooling, softmax output, and the Adam optimizer at a learning rate of 1×10⁻⁴ with a batch size of 32.
- Didn't build
- Transfer learning from a large pretrained model.
- Cost
- A lower ceiling on accuracy, especially with only 535 classification images.
Stretch a small dataset
- Options
- Train on the raw images or augment them.
- Evidence
- The classification set was small.
- Chose
- Convert DICOM files to PNG for TensorFlow, then flip and rotate images to enlarge the dataset. Split 75% train, 15% validation, 10% test.
- Didn't build
- Gathering additional data from other sources.
- Cost
- Augmented copies aren't new patients, so they inflate the dataset without adding real variety.
Solution
The finished system is a detector feeding a classifier: the first network decides whether a slice contains a nodule, and if so passes it to the second, which outputs benign or malignant. I trained both with backpropagation and used the validation set to tune them.
Outcome
The detector correctly found nodules 93.8% of the time, and the classifier labeled them correctly 75.5% of the time. Radiologists' correct-diagnosis rate is about 81%, so the classifier fell short of that benchmark.
The project won the Intel Excellence in Computer Science Award, second place at the Long Island Science and Engineering Fair, and the Yale Science and Engineering Most Outstanding Exhibit Award. With a 10% test split, the classification test set was roughly 50 images, so the 75.5% figure carries wide uncertainty.
Do differently
- Split by patient before augmenting, so no image or copy of one patient appears in both training and test data.
- Report sensitivity and specificity, not only accuracy. For cancer, missing a malignant nodule and flagging a benign one are very different mistakes.
- Validate on a second dataset from a different hospital before trusting any of the numbers.